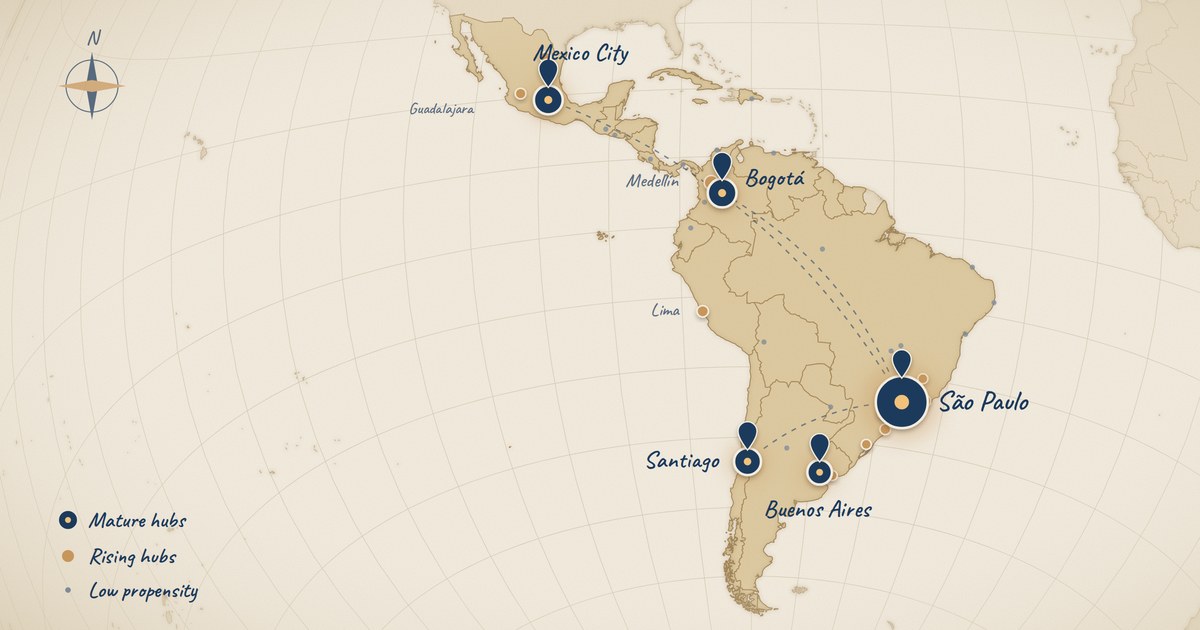
Every Latin America entry strategy starts with the same question: which industry? Fintech, agribusiness, healthcare, manufacturing. It is the right question — and an incomplete one. Two companies in the same sector, the same size, with the same problem, buy in completely different ways depending on where they sit. An insurer in São Paulo and one in Recife are not the same customer. A manufacturer in Monterrey and one in Guadalajara are not either. This article organizes the innovation indices available in 2026 — by country and by city — into a practical guide for deciding where to sell first, with which model, and with what cycle to expect.
Why the geography of innovation matters more than it looks
In every technology operation I have led or built in Latin America, the revenue map never followed the GDP map. It followed the map of innovation propensity: where there was a density of companies with a CIO, a technology budget separate from finance, a strong university nearby, and competitors that had already bought the same category. In those places the sales cycle was visibly shorter and the average deal larger. Outside them, the same product required twice the market education — and often a local partner to close.
That pattern has not changed. It has only become measurable. There are now at least six public indices that measure, with reasonable methodology, a territory's capacity and willingness to adopt new technology. The common mistake is to ignore them and plan GTM by industry and company size alone. The second mistake is to treat them as a "best country" ranking, when what they offer is something else: a proxy for how much the B2B buyer in that region has already been exposed to solutions like yours.
Industry tells you who has the problem you solve. Innovation propensity tells you who is ready to pay for a new solution. You need both coordinates to avoid spending 12 months in the wrong place.
What the indices measure — and what they don't
Before the numbers, a calibration. None of these indices measures "B2B buying behavior." They measure inputs (researchers, patents, venture capital, digital infrastructure, institutions) and outputs (startups, unicorns, technology exports). For our purpose, they work as indicators of three things that directly affect the sales cycle:
- Buyer sophistication: how many companies in the region already have a technology function with its own budget and the vocabulary to evaluate your proposal.
- Reference density: how many potential reference customers exist within one meeting's distance. Local social proof shortens cycles more than any international case study.
- Talent and partner availability: if you are going to hire a senior salesperson or sign a channel partner, the innovation hubs are where they are.
WIPO's Global Innovation Index 2026 is released on September 29, 2026 — after this article. The country data below uses the 2025 edition. WIPO's cluster ranking (September 2026), StartupBlink 2026 (May 2026) and Brazil's State Competitiveness Ranking (August 2026) are already the current editions. When using this guide, check the year of each source before making an investment decision.
Level 1 — Countries: four profiles, not a ranking
The table below cross-references the three sources most used by investors and global companies. Notice that they disagree with each other — and the disagreement is the most useful information.
| Country | GII 2025 (WIPO) global rank |
StartupBlink 2026 global rank |
ILIA 2025 (ECLAC) AI maturity |
VC raised 2025 |
|---|---|---|---|---|
| Chile | 51st (1st in region) | 3rd regional, down 2 places | Pioneer | n/a (notable in fintech and B2B software) |
| Brazil | 52nd | 26th (1st in region for 7 years) | Pioneer | US$2.0–2.2B |
| Mexico | 58th | 47th (down 4 places since 2022) | Adopter | US$1.8B |
| Uruguay | 68th | 6th regional | Pioneer | n/a |
| Colombia | 71st | 35th (+1; ecosystem grew 29%) | Adopter | US$0.7B |
| Costa Rica | 72nd | 8th regional | Adopter | n/a |
| Argentina | 77th | 46th (stable; +12%) | — | n/a |
| Peru | 80th | 72nd (down 5 places) | — | n/a |
| Panama | 82nd | 78th (+8; ecosystem grew 61%) | — | n/a |
Sources: WIPO Global Innovation Index 2025; StartupBlink Global Startup Ecosystem Index 2026; ECLAC/CENIA Latin American AI Index 2025; LAVCA and Mexico Business News (VC 2025). "n/a" = not disclosed in the sources consulted.
Four profiles come out of that table:
1. Chile: the most sophisticated buyer, the narrowest market
Chile has led the GII in the region for years on the strength of institutions, digital infrastructure and university-industry collaboration. At the same time, WIPO's own report flags the weakness: difficulty converting inputs into outputs. In B2B practice, this means demanding buyers, formal procurement, good contract discipline — and a market of 20 million people where three large customers exhaust a segment. Excellent for a pilot and a reference in regulated sectors (mining, financial services, utilities). Poor as a sole market.
2. Brazil: the highest density, the highest concentration
Brazil is the only country in the region with a cluster among the world's top 50 (São Paulo, 49th in WIPO's 2026 cluster ranking) and has led StartupBlink's regional table for seven consecutive years. But ILIA and the GII show the same limitation as Chile: strong inputs, weak conversion, little private R&D. For anyone selling, Brazil is less a country than a city-state with a heterogeneous interior — which is why the state- and city-level analysis further down matters more here than in any other market.
3. Mexico: the biggest check, the least predictability
Mexico raised US$1.8 billion in venture capital in 2025, and in the second quarter it surpassed Brazil in funding for the first time since 2012. Mexico City has an ecosystem value of US$27 billion and is the second Latin American cluster in WIPO's top 100 (82nd). Yet in the ecosystem ranking the country has dropped four places since 2022, and ECLAC classifies it only as an AI "adopter." What this tells the B2B seller: the money exists, above all in fintech and the nearshoring industrial chain, but buying maturity outside the capital, Monterrey and Guadalajara is far lower than GDP size suggests.
4. Colombia: the momentum
Colombia is the only large market rising across every index at once: 35th on StartupBlink (ecosystem +29% in a year), Bogotá established as the region's third city and Medellín as its fastest-growing one. It has neither Brazil's size nor Mexico's capital, but it has something both have lost: buyers who have not yet been carpet-bombed by vendors. Shorter cycles, less competition for attention, and a government pushing digitalization. It is the market where a second entry wave usually returns the most per dollar invested.
The last two numbers summarize the B2B opportunity in the region: usage demand above the world average, investment supply below it. The Latin American buyer experiments with technology faster than the capital statistics suggest. Whoever arrives with a finished product finds a willing user — and an undercapitalized local competitor.
Level 2 — Cities: where the sale actually happens
A country is the unit of contract, currency and tax. A city is the unit of sale. City rankings are more useful for deciding where to hire the first salesperson, where to open an office, and in what order to sequence expansion.
| City | StartupBlink 2026 score |
StartupBlink 2025 global rank |
Growth 2025 | Recognized strength |
|---|---|---|---|---|
| São Paulo | 44.4 | 23rd | +21% | Fintech (5th worldwide); AI; SME management software. GSER 2026: 37th globally |
| Mexico City | 15.0 | 43rd | +3% | Marketplaces (5th worldwide); fintech; US$27B ecosystem value |
| Bogotá | 14.9 | 62nd | +22% | Logistics and transportation; consistent upward trajectory |
| Santiago | 13.3 | 75th | +20% | Highest growth among the top five; recovering momentum |
| Buenos Aires | 11.3 | 77th | +15% | Technical talent; services exports |
| Medellín | 7.2 | 145th | +41% | Fastest growth in Colombia |
| Rio de Janeiro | — | 150th | +14% | Second Brazilian hub; overtook Curitiba |
| Lima | — | 182nd | +30% | Back in the regional top 10 after two years out |
Sources: StartupBlink Global Startup Ecosystem Index 2025 and 2026; Startup Genome GSER 2026. 2026 scores and 2025 global ranks are not directly comparable with each other.
The most important reading of the table is not the top. It is the distance between first and second: São Paulo has almost three times Mexico City's score. There is no "number two" in Latin America — there is São Paulo, then a pack of four similarly sized cities (Mexico City, Bogotá, Santiago, Buenos Aires), followed by a group of rising hubs.
What changes by city in B2B selling
Level 3 — Inside Brazil: the country that is three countries
If your target market includes Brazil, the national view hides the variable that most affects results. The 2025 FIEC State Innovation Index gives the number: São Paulo scores 0.872 against a national average of 0.296 — almost three times the average. Only six of the 27 states sit above it.
| State | FIEC Index 2025 | CLP Ranking 2026 overall competitiveness |
Hubs relevant for B2B |
|---|---|---|---|
| São Paulo | 0.872 | 2nd | São Paulo city, Campinas, Osasco / ABC region |
| Santa Catarina | 0.449 | 1st (first time in 15 editions) | Florianópolis, Joinville, Blumenau |
| Paraná | 0.413 | 3rd | Curitiba, Londrina, Maringá |
| Rio de Janeiro | 0.410 | — | Rio city (oil & gas, media, healthcare) |
| Rio Grande do Sul | 0.398 | 4th | Porto Alegre, Caxias do Sul |
| Minas Gerais | 0.368 | — | Belo Horizonte, Uberlândia |
| National average | 0.296 | — | |
| Alagoas / Maranhão / Acre | 0.148 / 0.127 / 0.122 | — | Channel and distribution territory |
Sources: FIEC State Innovation Index 2025 (National Industry Observatory / INPI); State Competitiveness Ranking 2026 (CLP / Tendências), published August 27, 2026.
Two movements deserve the attention of anyone planning 2027:
Santa Catarina overtook São Paulo in overall competitiveness for the first time in 15 editions of the CLP ranking, and sits second in the innovation pillar. Florianópolis leads the innovation and human capital dimensions of Enap's Entrepreneurial Cities Index. For B2B software, that means a dense buyer base with a technology culture and smaller deal sizes than São Paulo — a good second territory for anyone who has already closed their first customers in the São Paulo capital.
São Paulo's interior is a market of its own. Campinas concentrates infrastructure and innovation (Unicamp, CPqD, technology parks); Osasco and the ABC region rank among the country's ten most entrepreneurial cities on access to capital. A salesperson based in the capital covers that market — but only if their territory is designed with it in mind.
Every year I watch software companies hire a salesperson in Recife or Salvador because "the Northeast has 27% of the population." It does. And of the six states that rose in the 2025 FIEC index, five are in the Northeast — rising from a very low base. It is channel, distributor and regional-partner territory, not direct-sales territory for a startup. The CAC math does not close before 24 months. For the model that does work in these regions, read how to structure a B2B channel program.
Outside Brazil: the same concentrations
The concentration pattern repeats in every large market in the region — which simplifies planning more than it seems:
- Mexico: IMCO's 2025 State Competitiveness Index puts Mexico City, Baja California Sur and Nuevo León as the three most competitive states. For B2B tech, the triangle of Mexico City (services, fintech, corporate), Monterrey (industry, nearshoring) and Guadalajara (technology, electronics) covers most of the addressable market.
- Colombia: the 2025 Departmental Competitiveness Index scores Bogotá 8.13, Antioquia (Medellín) 6.82 and Valle del Cauca (Cali) 6.30. The gap between the top and bottom department in the innovation pillar exceeds 7.5 points out of 10. Bogotá and Medellín are the market; the rest is channel.
- Chile and Argentina: Santiago and Buenos Aires concentrate an even larger share of the B2B market than São Paulo does in Brazil. One person in each covers the country.
- Uruguay: small, but an AI "pioneer" according to ECLAC and a strong IT services exporter. It works well as an operations hub or talent base, less so as a market.
How to use this in practice: the propensity map
The simplest way to build this variable into planning is to add a third coordinate to your territory model. Most companies already cross industry with company size. Add the territory's innovation propensity and the result is a matrix that says not only whom to approach, but where and how.
| Tier | Territories (2026) | Recommended model | What to expect |
|---|---|---|---|
| Tier 1 — Mature hubs | São Paulo, Mexico City, Bogotá, Santiago, Buenos Aires | Direct sales, own team, physical presence | Predictable cycles, more competition, value-based price tolerance |
| Tier 2 — Rising hubs | Medellín, Florianópolis, Curitiba, Campinas, Monterrey, Guadalajara, Porto Alegre, Belo Horizonte, Montevideo, Lima | Remote salesperson who travels, or a partner with regional exclusivity | Less competition, local reference decisive, deal sizes 20–40% smaller |
| Tier 3 — Low propensity | Remaining capitals and interior; Brazil's Center-West and North; Central America (except Costa Rica and Panama) | Channel, distributor, marketplace | Long market education; direct CAC does not close; opportunity in specific verticals (agribusiness, mining, government) |
Year 1: São Paulo, with your own team. Close 5 to 10 reference customers. Year 2: a second tier-1 city chosen by vertical (Mexico City for fintech and industry; Bogotá for logistics and services; Santiago for regulated sectors) plus one or two tier-2 hubs in Brazil covered from São Paulo. Year 3: channel for tier 3. Reversing that order — starting with channel in low-propensity markets to "cover the region" — is the mistake I have most often seen cost the first year. I cover it in the myth of the channel that sells itself, and the broader entry-model choice in optimizing your LATAM entry model.
Three caveats before you apply it
First: territory propensity does not replace sector propensity. A mining company in Chile or an agricultural cooperative in the interior of Paraná can be a more sophisticated buyer of specific technology than a fintech in São Paulo. The territorial index is the default ruler; the vertical adjusts it.
Second: government distorts the map. Brasília does not show up in innovation rankings, yet it is the country's largest single buyer of technology. If your strategy includes the public sector, the geography is different — and so are the rules, as I describe in how we won a US$15 million government contract without shortcuts.
Third: the indices measure innovation supply, not pent-up demand. A tier-3 territory with one dominant industry and no local supplier can be the best deal in your pipeline. The matrix is there to prioritize the pattern, not to forbid the exception.
Conclusion
Latin America is not one market. It is São Paulo, four mid-sized capitals, a dozen rising hubs, and an enormous territory where direct technology sales still do not pay for themselves. The 2026 innovation indices make that geography measurable — and measurable means plannable.
Use industry to know who has the problem. Use innovation propensity to know who is ready to buy the solution. Use coverage capacity to know what you can serve without breaking CAC. Together, the three produce a territory plan that survives the first quarter of reality.
The Latin American market is not too big for a software company. It is too big for a software company that treats Recife and São Paulo as the same customer.
Entering Latin America? Where you start decides how long the first year takes.
The Build, Operate & Transfer model puts an operator on the ground in the right hub first — with the territory sequence, the local references and the channel decisions already mapped.
Explore the Build, Operate & Transfer Model →